The Anatomy of the Sell-Off
GLADIUS SOLUTIONS - VOLATILITY VIEWS | Q3 2022
The manner and dynamics which a market exhibits as it moves to the downside can be one of the most insightful pieces of information for investment professionals. Selloffs come in all shapes and sizes and while many can feel traumatic, they often exhibit vastly different characteristics. As volatility professionals, we are equally focused on both the speed and magnitude of market movement during selloff periods. When stocks fall with chaotic volatility far above the expectations of the market, dramatic increases in risk parameters like implied volatility and what we call “implied volatility skew” occur. On the other hand, when markets fall in a rational and orderly fashion, we typically see those risk parameters fall and underperform expectations. Many times, it can feel like an incongruous relationship between the level of angst felt by investors and the actual manifestation of a market correction. This was exactly the case for the first half of this year.
It’s been hard to find investors who are bullish during 2022. The macro backdrop feels particularly poor with soaring out of control inflation, quantitative tightening looming (something we think will be a strong catalyst for market volatility in the second half of the year), a potential recession on the horizon, and of course the Russian invasion of Ukraine. Since the start of the year, global equity markets have been under pressure. The SP500 has fallen 20.6% YTD (as of 6/30/22) and its average realized volatility, a measure of the speed at which it moves, has almost doubled – from 13.8 to 24.9. Interestingly, other equity capital markets have exhibited a remarkable correlation between their rise in realized volatility and their place in the global tightening cycle. The US has experienced the largest percentage rise in equity volatility, 80%, followed by Europe, 50%, and lastly Japan, still in full accommodative monetary policy mode, at 20%.
Despite the large rise in equity realized volatility in the SP500, downside equity options proved to be highly overpriced during the first half of the year. Here is a graph of what we call two-month implied skew, illustrated as the implied volatility differential between the 25 delta Put and the 25 delta Call, expressed as a fraction of the at the money volatility:
2 Month Implied Skew Graph

Source: Gladius proprietary and Bloomberg
The graph measures the difference in implied volatility between downside puts and upside options. We select two-month options as barometer because it’s a commonly used maturity for liquid hedges while being free of any effects arising from longer dated structured products. We can see the level of implied skew collapsed during the market selloff in the first half to multi-year lows. This meant that the implied volatility of puts relative to upside calls moved sharply lower despite the markets falling over 20%.
Why did this occur? The most likely reason in our view is that following so many years of strong equity gains, the violence of the drop in equity markets, other than a few days, was simply not sufficient to induce any panic among equity investors. The selloff was quite organized in nature and seemed to promote an almost accepted indifference from long equity holders.
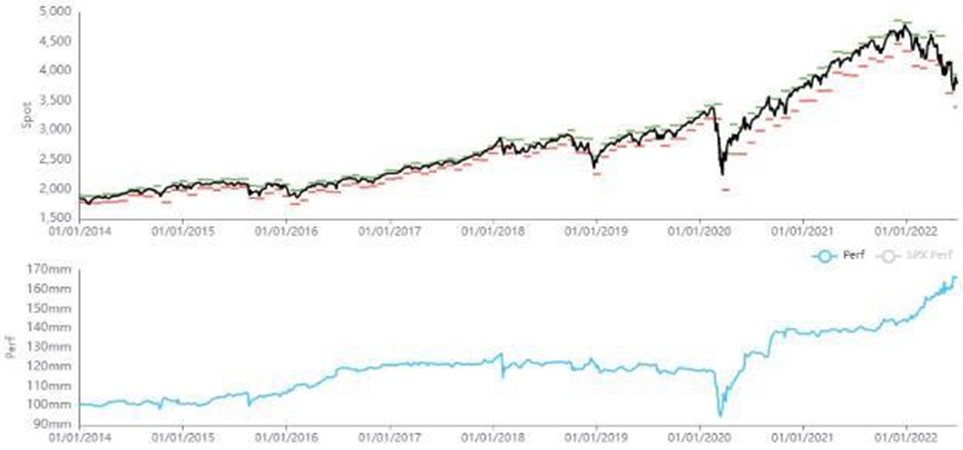
The movements we witnessed in equity implied volatilities mean that any strategies which were net sellers of tail risk have had a very good year so far. As an example, here is a graph of a systematic short-tail risk strategy. This strategy extracts the implied volatility skew risk premium by selling downside puts and buying upside calls in a delta neutral (market neutral) fashion, and we can see the performance of the strategy for H1 2022 was the best period over the last several years. That fact speaks to the almost unprecedented lack of reactivity of downside options on the SP500. The muted behavior of out of the money puts on the SP500 was a significant deviation well outside normal expectations.
Short Skew Performance Graph

Source: Gladius proprietary and Bloomberg
Looking Ahead:
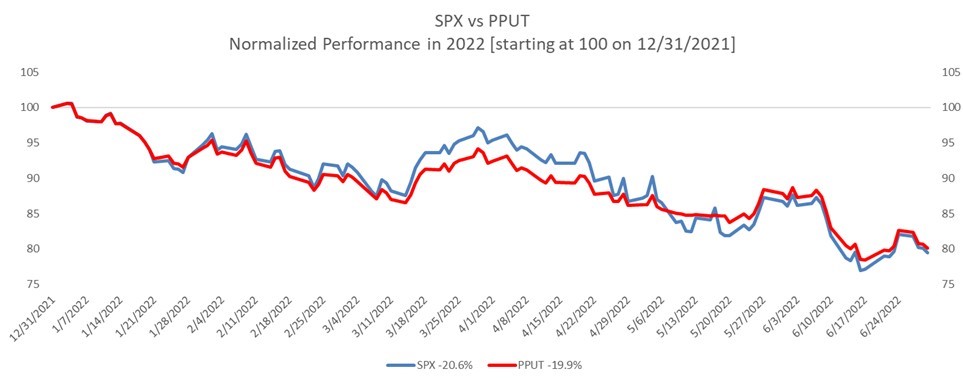
If one had been a prudent equity investor during H1 and utilized short-dated options as part of a hedging program, there was little tangible benefit in doing so this year. Here is a graph of a systematic strategy which monthly buys 5% out of the money puts while holding SP500 long futures:
Performance SPX vs PPUT

Source: Gladius proprietary and Bloomberg
As we can see, the returns are almost identical to those of the outright SP500 index meaning there was little added value to hedging so far this year. The salient question is whether this is expected to continue for the second half of the year.
We are not venturing whether a second major market correction will occur in 2022, but we postulate that if one occurs, it’s likely to be significantly different than what we saw in H1. We believe the next time the market breaks the previous lows there will be a much higher degree of violence and turmoil complete with significantly higher correlation and volatility. Our reasons for this are based on a couple of thoughts:
- When Quantitative Tightening fully kicks offs, the liquidity removal from the market can cause a drastic fragmentation of risk capacity which should serve as a strong catalyst for We have decades of accommodative policy to unwind.
- The equity risk premium has not really moved significantly at all since the start of the year even with the backdrop of falling earnings. We think this has room to expand to levels more commensurate with a meaningful market correction.
- Structural dampening effects on longer dated implied volatility are likely to be lower given the slowdown of issuance in retail products
- Traditional rebalancing programs which normally provide a strong bid to equities in falling markets may not do so this time on account of inflation-driven fixed income movements and new asset allocation parameters (more on this in a following piece).
- Within the equity volatility world, short risk strategies like dispersion (short implied-correlation) and short index implied skew (short tail-risk) enjoyed near unprecedented levels of success during the first half of the year. We don’t think this is likely to repeat in the case of another market downturn.
We therefore advocate a highly vigilant stance and even though hedging and convexity programs have not been necessarily fruitful so far this year, we believe they have a strong role to play in the upcoming months. The significant collapse of implied volatility on SP500 skew presents a unique opportunity for those investors seeking to protect their portfolios and we believe it should be availed.
If you have any comments or questions please let us know. We would be delighted to have call to discuss further.
Sincerely,
The Gladius Team | [email protected]
LEGAL DISCLAIMER
This information is being provided to you on a confidential basis and may not be reproduced, in whole or in part, and may not be delivered to any person without the prior written consent of Gladius Capital Management LP (“Gladius” or the “Manager”). If you are not the intended recipient of these materials, you are hereby notified that any unauthorized dissemination, distribution, use or copying of these materials is strictly prohibited, and you are asked to destroy the materials and contact us immediately.
This document is for informational purposes only and does constitute an offer to sell, or a solicitation of an offer to buy, interests in any private investment vehicle managed by Gladius. No such offer or solicitation will be made prior to the delivery of the private offering memorandum (the “Memorandum”) and other disclosure materials. Before making an investment decision with respect to a fund managed by Gladius (each, a “Fund” and together, the “Funds”), prospective investors are advised to read carefully the Memorandum, the operating and other constituent documents of the Fund and the related subscription documents, and to consult with their tax, financial and legal advisers. The information herein is not intended to provide, and should not be relied upon for tax, accounting, legal or investment advice. Prospective investors may not subscribe for interests in any Funds unless they meet the criteria described in the Memorandum and constituent documents of the Funds and the related subscription agreement.
Certain information contained herein constitutes forward-looking statements (including projections, targets, hypotheticals, ratios, estimates, returns, performance, opinions, activity and other events contained or referenced herein) which can be identified by the use of terms such as “may,” “will,” “should,” “expect,” “anticipate,” “project,” “estimate,” “intend,” “continue,” “believe” or the negative version of these words or other comparable words. Due to various risks, assumptions, uncertainties, and actual events, including those discussed herein and in the Offering Memorandum and/or other fund governing documents, actual results, returns or performance may differ materially from those reflected or contemplated in such forward-looking statements. As a result, prospective investors should not rely on such forward-looking statements in making their investment decisions. Any forward-looking statements contained herein reflect Gladius’ current judgement and assumptions which may change in the future, and Gladius has no obligation to update or amend such forward- looking statements.
Hypothetical performance results used in this presentation have many inherent limitations, some of which are described below. No representation is being made that any account will or is likely to achieve profits or losses similar to those shown. In fact, there are frequently sharp differences between hypothetical performance results and the actual results subsequently achieved by any particular investment strategy. One of the limitations of hypothetical performance results is that they are generally prepared with the benefit of hindsight. In addition, hypothetical trading does not involve financial risk, and no hypothetical trading record can completely account for the impact of financial risk in actual trading. For example, the ability to withstand losses or to adhere to a particular trading strategy in spite of trading losses are material points which can also adversely affect actual trading results. There are numerous other factors related to the markets in general or to the implementation of any specific trading strategy which cannot be fully accounted for in the preparation of hypothetical performance results and all of which can adversely affect actual trading results.
An investment in the Funds is speculative and high risk. There can be no assurance that the Funds’ investment objectives will be achieved. There is no material limitation on the strategies, markets, instruments or countries in which the Funds may trade. By investing in a Fund, investors are relying on the discretionary market judgment of Gladius, trading in a wide range of strategies and markets, as well as in investing in positions with a wide range of different durations, without being subject to diversification, leverage or any other form of trading policies. The Funds employ leverage which can make investment performance volatile. Investors’ ability to withdraw from the Funds is strictly limited, so investors may not have access to capital when it is needed. There is no secondary market for the interests in the Funds and none is expected to develop. An investor should not invest in the Funds unless such investor is prepared to lose all or substantially all of its investment. Past performance is no indication of future results.
This summary does not purport to be complete and is qualified in its entirety by reference to the detailed disclosures contained in the Memorandum and fund documents. Gladius makes no representation or warranty, express or implied, as to the accuracy or completeness of the information contained herein.
CONTACT: [email protected]

